One river, one server room, a year.
A small server room runs on a small river. In the dry months the river falls short. This study follows that year, month by month, and asks how much of the shortfall a change of schedule can remove.
This is an interactive study that runs in your browser. The river, the plant and the server room are invented, and every number comes from a short model written for this page. It is a way to think about the problem, not a measurement of any site in Northern Mindanao.
The river rises and falls.
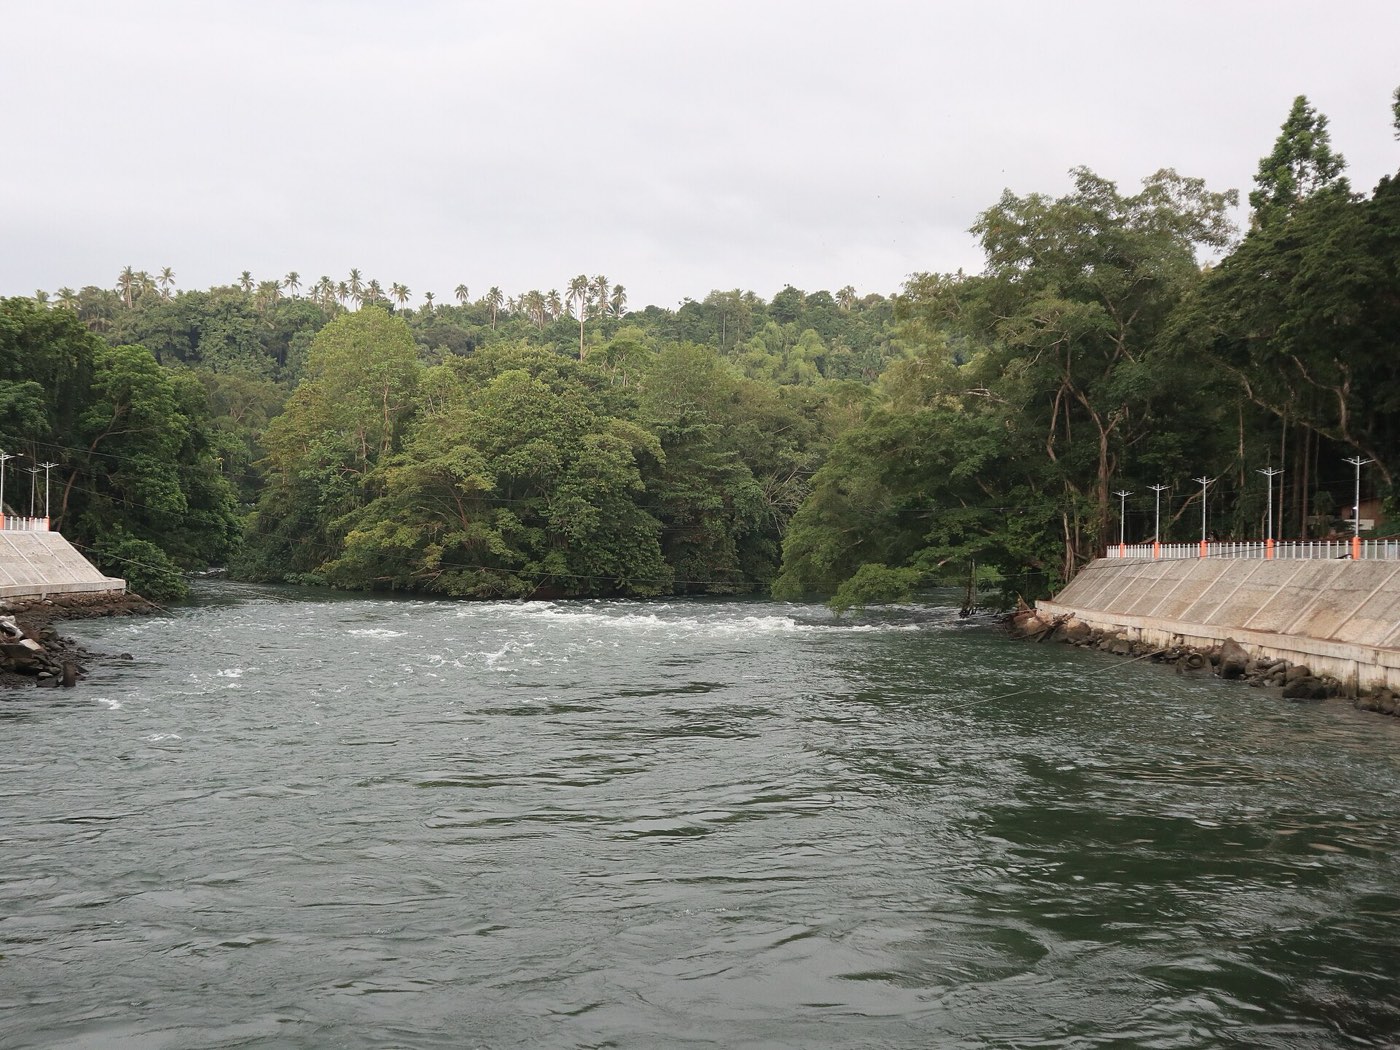
Picture a small run-of-river plant on a river in Northern Mindanao. At full flow it makes 220 kW. Run-of-river means there is no large reservoir: the plant can only use what the river carries that month.
From June to October the river is full and the plant runs close to its rating. In March and April it makes less than half.
- 220 kW
- Output at full flow, reached in August.
- 84 kW
- Output in April, the lowest month.
- 165 kW
- Average over the year.
The room never sleeps.
Beside the plant sits a server room that draws 150 kW every month of the year.
110 kW of that is fixed load: the services that have to stay up. The other 40 kW is batch work, such as nightly backups, video transcoding and model retraining. It runs at a steady pace because nobody has asked it to do anything else.
Four months fall short.
Put the two side by side and the problem shows. From February to May the river makes less than the room draws. March and April are worst: 99 and 84 kW of river against 150 kW of load.
- 91.1%
- Share of the year’s electricity the river covers.
- 116.8 MWh
- What would have to come from somewhere else.
Let the batch follow the river.
Batch work does not care which day it runs. Suppose the schedule follows the water: more batch in the wet months, almost none in the dry ones, the same total work over the year. The fixed load does not move. Nothing is bought; only the calendar changes.
- 97.9%
- Share of the year’s electricity the river now covers.
- 27.3 MWh
- Left over, about a quarter of what it was.
What a calendar cannot fix.
Scheduling cannot move the fixed load. March and April still fall short, by 11 kW and 26 kW. This is where a battery, a grid connection or a second source would have to earn its cost.
This study does not try to size any of them. That question belongs to engineers who can measure the river.